
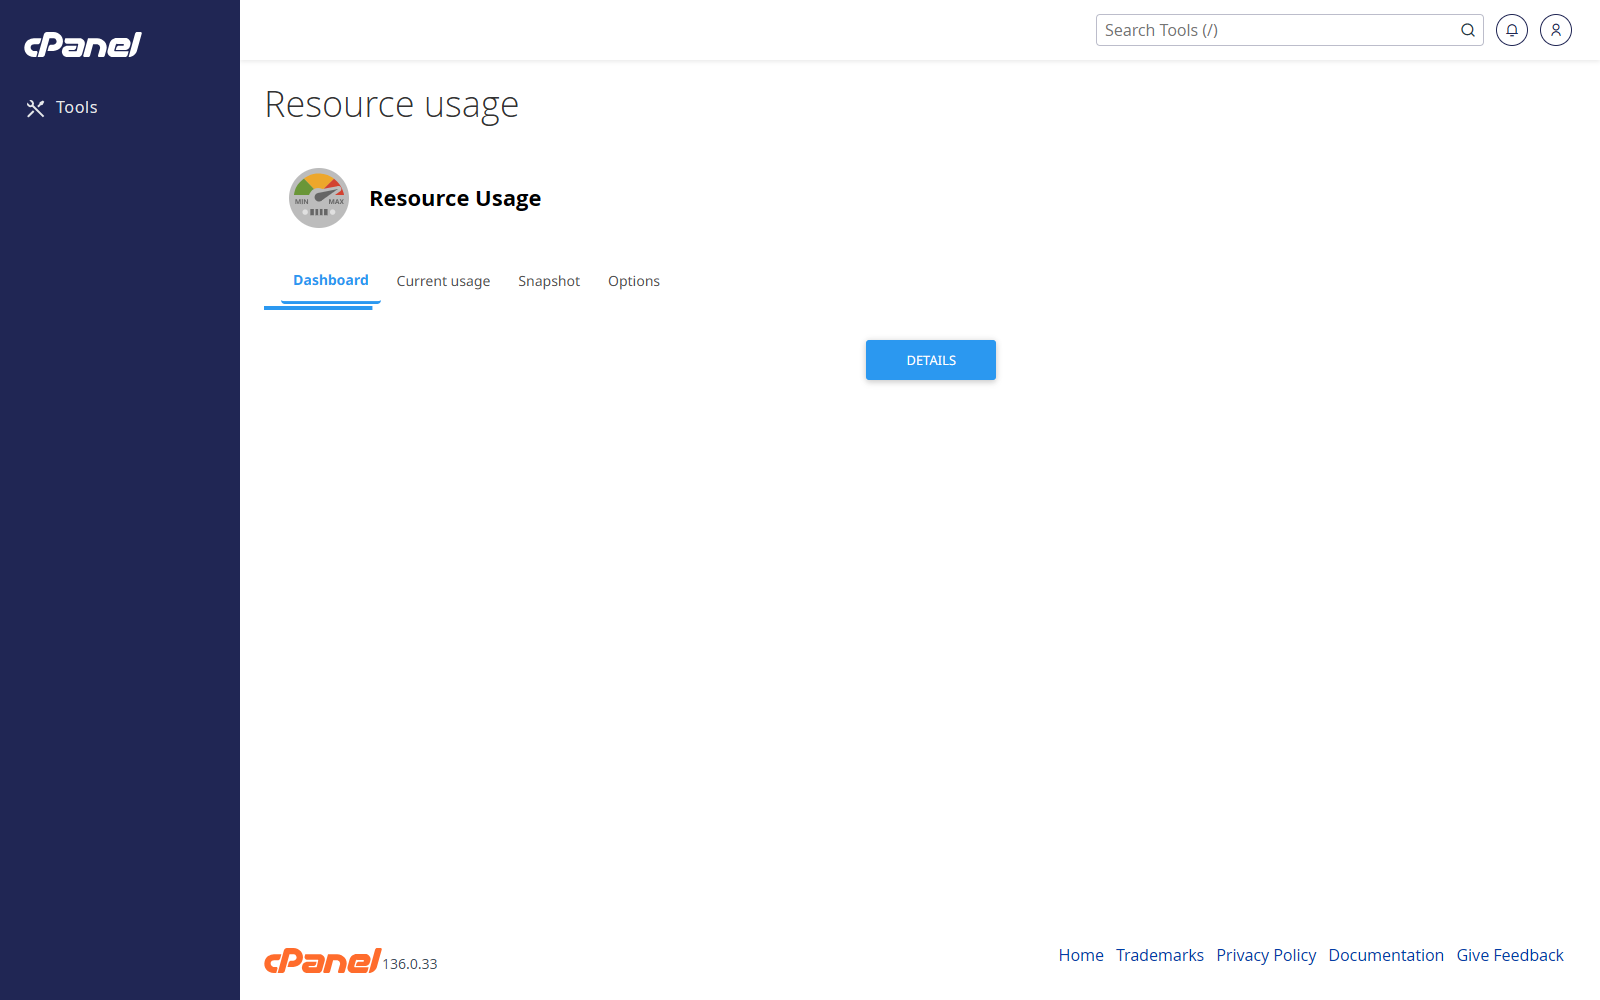
Open CPU and Connection Usage
- Go to Metrics > CPU and Concurrent Connection Usage.
- Review the current usage message at the top of the page.
- Click Details if cPanel shows that option.
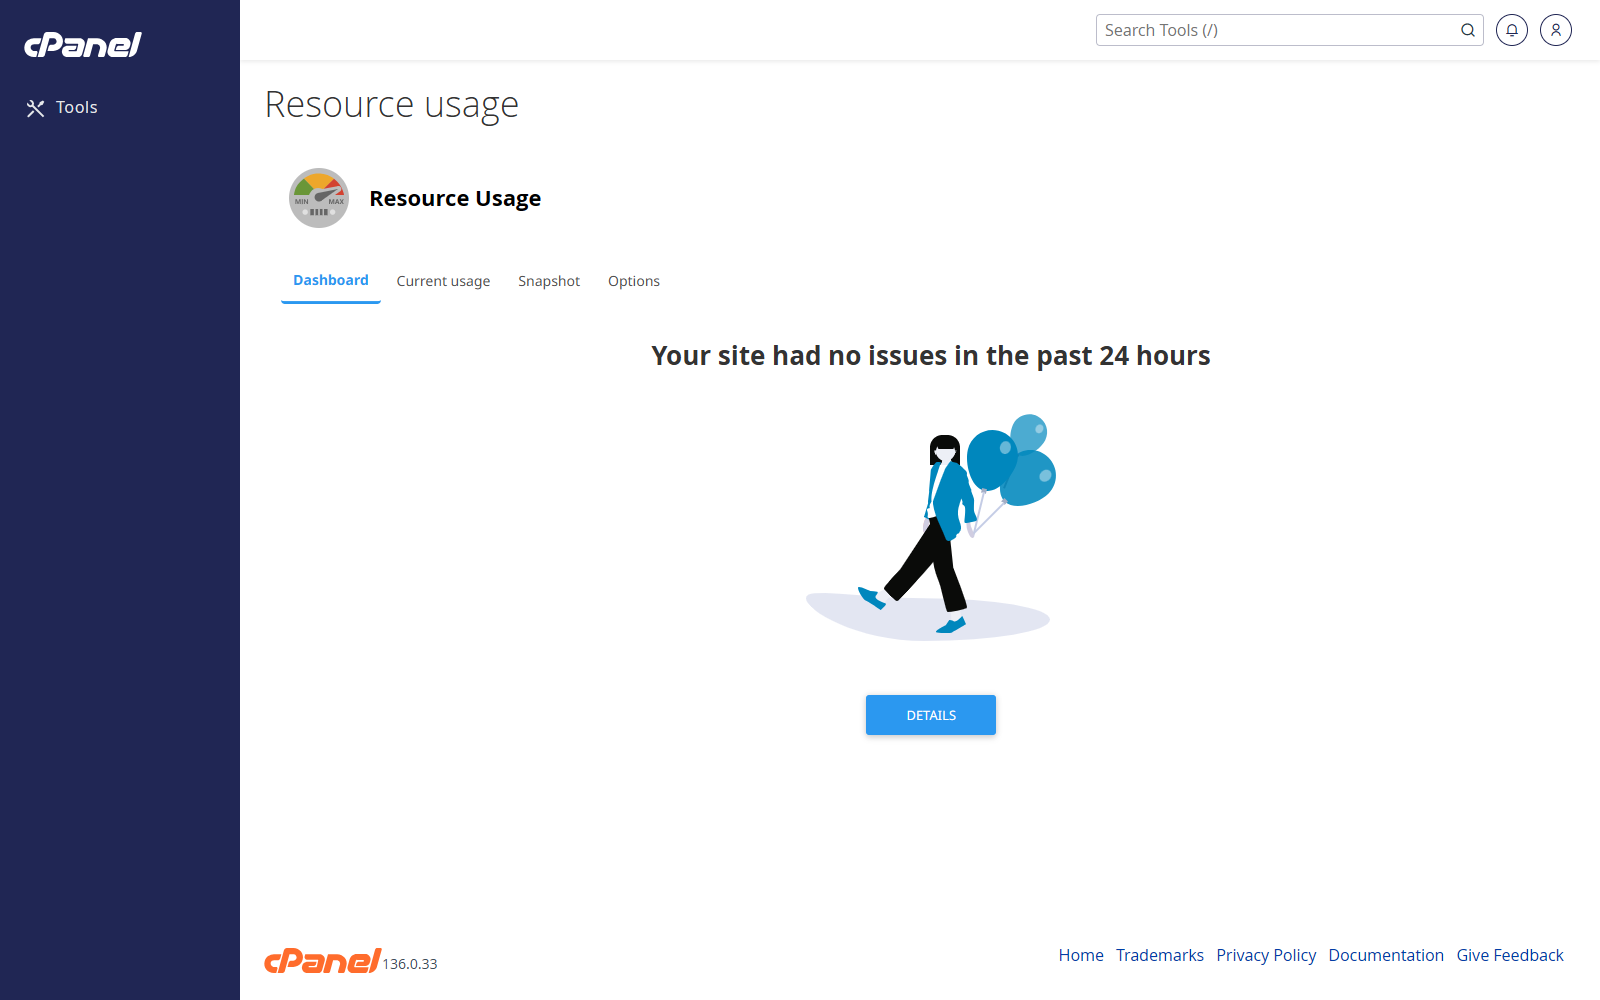
View Resource Usage Details
- Open the resource usage details screen.
- Choose the time period you want to review.
- Check CPU, memory, entry processes, I/O, and process usage.
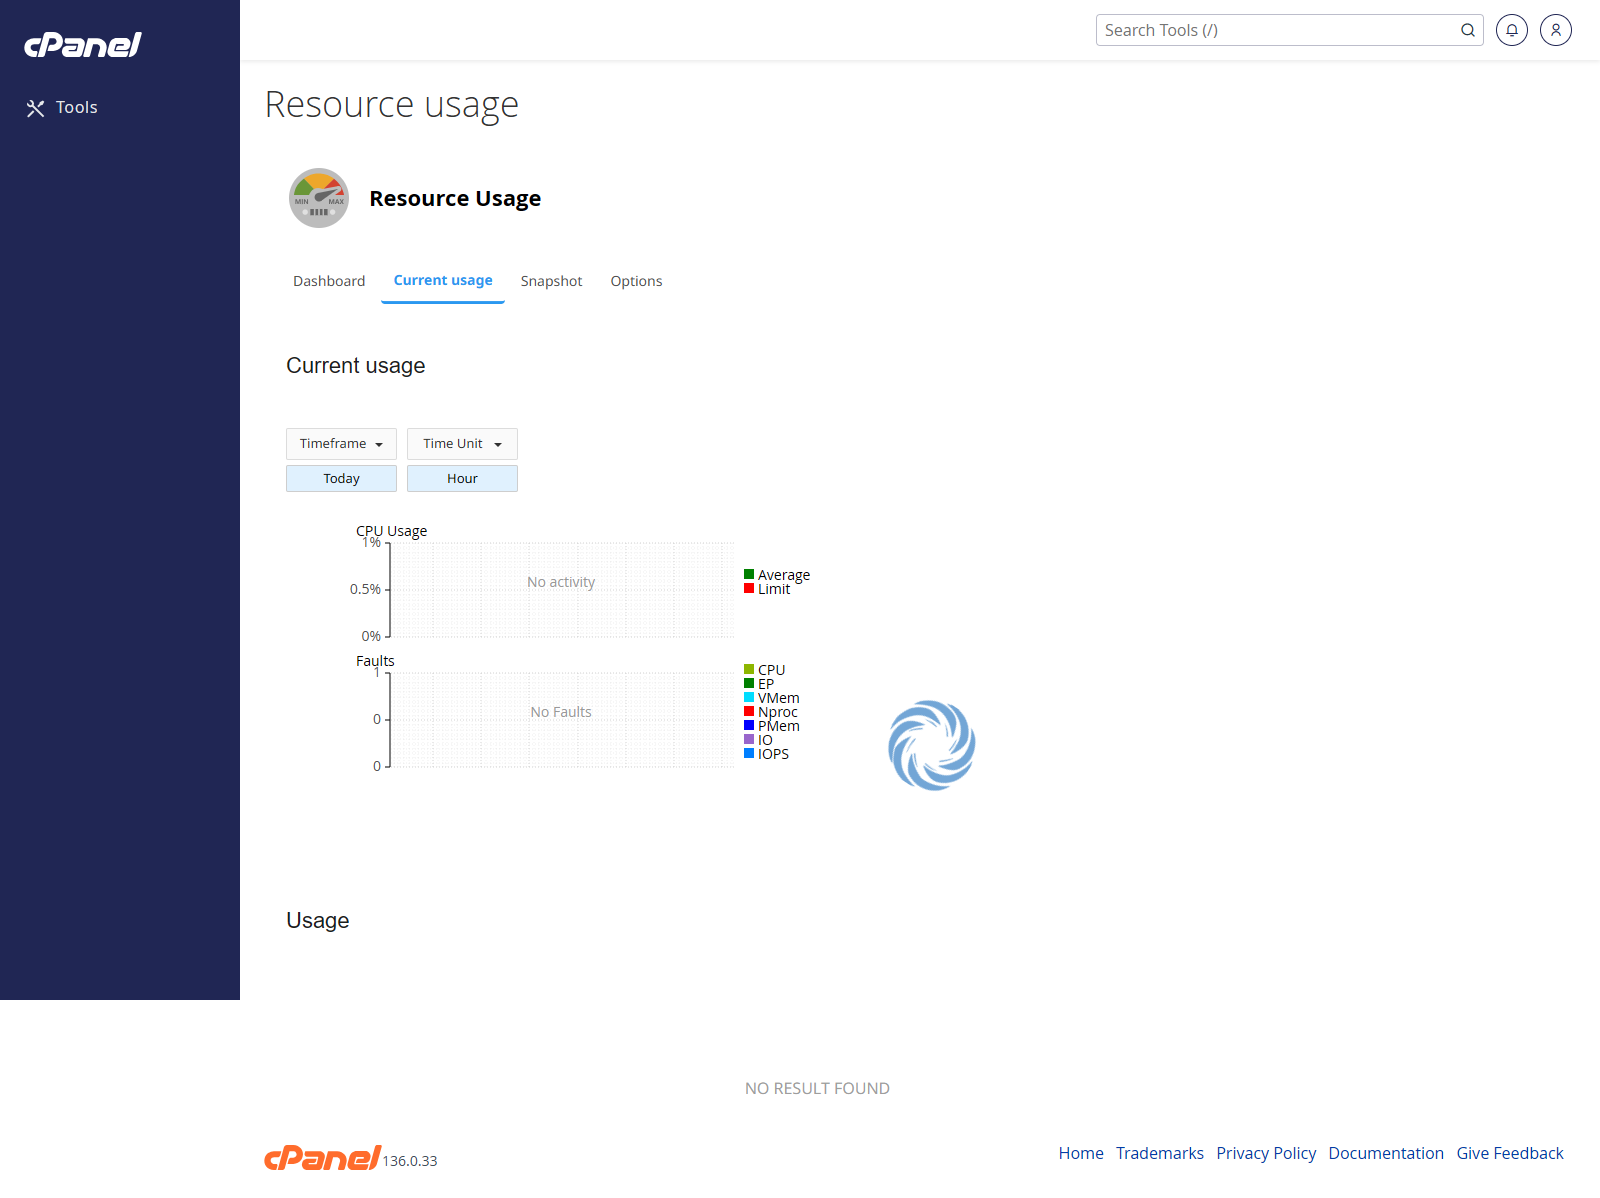
- Look for red or warning areas in the graphs.
Check Recent Faults
- Open the resource usage details screen.
- Find the faults or limits section.
- Check whether the account has hit CPU, memory, I/O, or entry process limits.
Notes
- Short spikes are normal.
- Repeated limit faults usually mean the site needs optimisation, caching, fewer heavy plugins, or a hosting plan with more resources.
- If this tool is not shown in cPanel, resource usage reporting may not be enabled on the server.